Metrixa – KPI Dashboard PowerPoint: Built for Data-Driven Decision Makers
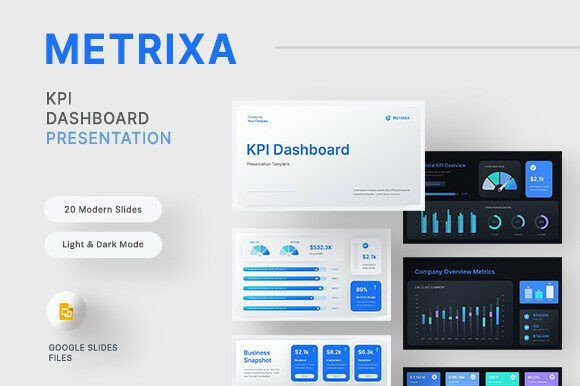
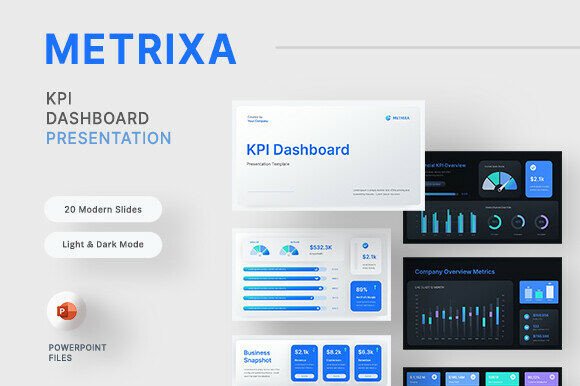
Presenting data effectively is often harder than analyzing it. You might have the numbers, the insights, and the strategy, but if your slides feel flat or outdated, the message can lose its impact. That’s where Metrixa – KPI Dashboard PowerPoint steps in. This template isn’t just another set of slides; it’s a purposeful tool designed to bridge the gap between raw data and compelling storytelling. With its metallic-inspired aesthetic and clean blue–silver palette, it brings a futuristic dashboard feel that mirrors real enterprise SaaS platforms. The result is a presentation that looks and feels like a live analytics interface, even when you're standing in a boardroom.
What makes Metrixa KPI Dashboard stand out is its deliberate focus on utility. Every element—from charts to bars to infographics—is fully editable. That means you never have to rely on static PNG images or struggle with broken formatting. You can update figures, swap colors, and rearrange layouts without needing a designer. For anyone who regularly presents monthly reviews, strategic plans, or operational reports, this template turns a tedious task into a seamless experience. The 30-slide deck covers everything from executive overviews to risk strategy, so you're not left hunting for missing sections. Instead, you can focus on what matters: telling a clear, data-backed story.
Who Needs a Metallic Dashboard Template?
You might be wondering whether a metallic-themed slide deck is right for your context. The short answer is that Metrixa – KPI Dashboard PowerPoint works well for a broad range of professionals. It’s particularly valuable for those who present to stakeholders who expect precision, polish, and a modern aesthetic. For instance, if you're in a SaaS company and you need to report on customer acquisition costs or churn rates, the dashboard-inspired layout naturally conveys that you're on top of the numbers. Similarly, finance teams presenting quarterly results will find the financial health section intuitive and visually aligned with what executives expect to see.
Beyond the corporate world, this template is also useful for consultants who need to deliver persuasive analytics reports. The metallic finish and clean typography give off a sense of sophistication, which can help build credibility with clients. Even internal teams—like operations or marketing departments—can benefit from the structured slide sections. The deck doesn't assume you're a data scientist; it assumes you have data to share and want to do it without friction. Whether you're a business owner reviewing KPIs with your team or a creator preparing a sponsored analytics showcase, Metrixa KPI Dashboard adapts to your narrative.
Key Features That Make a Difference
Understanding the features of Metrixa – KPI Dashboard PowerPoint helps you gauge whether it fits your workflow. Here are the standout characteristics that go beyond superficial design:
- Complete editability: Bar charts, line graphs, infographic widgets, and text boxes are all native PowerPoint objects. You can resize, recolor, or reconfigure them without external tools. This is a major time-saver when you need to tweak a slide right before a meeting.
- Light and dark modes: The template includes both variations, so you can match the presentation to your environment. A dark mode can be particularly striking in a dimly lit boardroom, while light mode works well for printed handouts or bright conference rooms.
- Free fonts and master slides: The template uses free fonts, with download links provided in the documentation guide. Master slides ensure that any global changes—like updating the company logo or adjusting the color accent—apply across the entire deck instantly.
- 30 purposefully organized slides: The structure covers executive overview, financial health, sales and marketing performance, customer and product insights, operations and team metrics, risk and strategy, and a closing slide. This means you don't have to build sections from scratch; you just populate them with your data.
- Full HD resolution (1920×1080): Every slide is optimized for 16:9 displays, ensuring your content looks sharp on modern monitors and projectors.
These features collectively reduce the time between having data and presenting it effectively. Instead of wrestling with alignment or inconsistent formatting, you can invest your energy in interpreting the numbers and preparing your speaking points.
Real-World Scenarios: Where the Template Shines
To appreciate the practical value of Metrixa – KPI Dashboard PowerPoint, consider a few concrete scenarios. Imagine you're a marketing director preparing a monthly performance review. You need to show campaign ROI, website traffic trends, and lead conversion metrics. With this template, you can pull the relevant slides from the sales and marketing section, plug in your data, and have a cohesive narrative ready in under an hour. The dashboard layout naturally groups related metrics, so your audience can grasp the story without getting lost in separate charts.
Another scenario could be a product manager presenting customer insights to the executive team. The customer and product insights section includes placeholders for satisfaction scores, usage data, and feature adoption rates. The visual hierarchy helps you highlight what's working and what needs attention. Because the template uses a metallic blue–silver palette, the slides feel modern and tech-forward—subtle cues that reinforce the idea that your team is data-savvy and forward-looking.
For operations leaders, the operations and team metrics section offers a clear way to present efficiency KPIs, project timelines, and resource allocation. The included risk and strategy slides are also valuable for quarterly business reviews where you need to balance wins with challenges. The closing slide provides a clean, professional endpoint for your presentation, allowing you to end on a polished note without fumbling for a final image.
Strengths and Considerations
Like any tool, Metrixa – KPI Dashboard PowerPoint comes with strengths that are worth noting, as well as a few considerations that can help you decide if it's the right fit for your project.
Strengths: The template's biggest advantage is its balance between aesthetic polish and functional flexibility. The metallic theme is distinctive without being distracting, and the blue–silver combination is professional and calming. The fact that all elements are vector-based or native PowerPoint objects means you can scale, recolor, and animate them without degrading quality. The inclusion of a documentation guide also helps beginners understand how to use master slides and font installation, lowering the barrier to entry for less experienced PowerPoint users.
Considerations: The metallic, dashboard-inspired design might not suit every brand or industry. If your organization uses warmer tones or a more minimal visual identity, the blue–silver palette could require adjustments. However, because the template is fully editable, you can customize the color scheme to an extent. Another point to keep in mind is that the template is designed for PowerPoint (PPTX format), so if you primarily use Google Slides or Keynote, you may need to convert the file, which could affect formatting. The documentation guide helps, but native use in PowerPoint is the smoothest experience.
Also, while the template includes 30 slides, you might find that you don't need every section. That's perfectly fine—you can delete or reorder slides as needed. The structure is there to give you options, not to force a specific flow. The key is to select the slides that align with your narrative and customize them to reflect your data and brand.
How to Evaluate If This Template Suits Your Needs
When deciding whether Metrixa KPI Dashboard is the right choice, consider your presentation frequency, your audience's expectations, and your own comfort with design customization. If you present data weekly or monthly, the time saved by using a polished template adds up quickly. If your audience expects a modern, sophisticated look—perhaps they're accustomed to SaaS dashboards or data-rich interfaces—this template will meet those expectations without requiring you to hire a designer.
For those who are less familiar with PowerPoint's advanced features, the master slide structure and included documentation make the learning curve manageable. You don't need to be a design expert to produce slides that look intentional and professional. Start by replacing placeholder text and charts with your own data, then adjust colors if needed. The template gives you a strong foundation, and you can build upon it gradually as you become more comfortable.
Ultimately, the value of Metrixa – KPI Dashboard PowerPoint lies in its ability to transform raw numbers into a coherent, visually engaging story. It respects your time by providing a framework that's ready to use, yet flexible enough to accommodate your unique data. If you're looking for a presentation tool that treats data with the seriousness and sophistication it deserves, this template is worth exploring. The metallic, dashboard-inspired design isn't just about looking cool—it's about signaling that you've done the work and you're ready to share insights with confidence.
Note: Images shown in previews are for illustration only and are not included in the download. The template includes all editable slides, documentation, and font links so you can start building your presentation immediately.