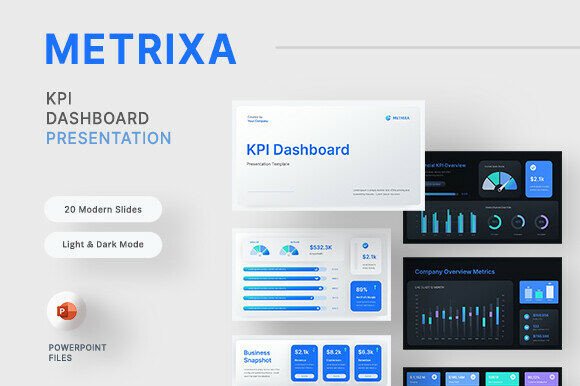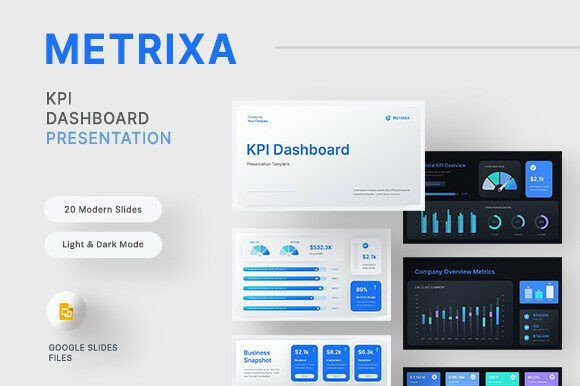
Metrixa – KPI Dashboard Google Slides: A Practical Guide for Real Business Reporting
If you have ever sat through a monthly review where the slides looked like they were built in 2005, you already know how much presentation design matters. The numbers might be solid, but if the visuals feel dated or cluttered, the message gets lost. That is where Metrixa – KPI Dashboard Google Slides comes into play. This is not just another template with a few charts thrown in. It brings a metallic-inspired aesthetic that feels closer to what you would expect from a modern SaaS platform than from a slide deck. And that distinction matters more than you might think.
What makes this template different from the usual dashboard slides
Most presentation templates rely heavily on static images. You drop in a PNG of a chart, and if the data changes, you are stuck editing an image or recreating the whole thing. Metrixa – KPI Dashboard Google Slides flips that approach. Every element is editable. The charts, the bars, the infographics—all built directly in the slide. That means when your quarterly numbers shift, you update the data in the slide itself, not in a separate program. For anyone who has spent an afternoon wrestling with image-based charts, that alone is a game changer.
The visual direction is clean and deliberate. Blue and silver tones give it a metallic finish that avoids being flashy while still looking polished. It works well for industries where precision and professionalism matter. Think finance, consulting, tech, operations, or even internal strategy teams that want to move away from generic templates.
Monthly performance reviews that actually get watched
Monthly reviews can feel like a checkbox exercise. You present the numbers, people nod, and the meeting ends. But when the slides themselves look like they belong in a boardroom, the room tends to pay more attention. The Metrixa template, with its executive overview and company financial health sections, lets you walk through revenue trends, expense ratios, and cash flow metrics without flipping between mismatched slides. The consistency in design keeps the audience focused on the story behind the numbers, not on the slide transitions.
Board meetings where first impressions count
Board members see a lot of presentations. If yours looks like the others, it blends in. If it has a distinct, modern dashboard feel, it stands out. The metallic aesthetic and the structured layout communicate that you have put thought into how the data is presented. The risk and strategy section is particularly useful here. Board conversations often shift from what happened to what could happen. Having a dedicated slide section for risk metrics and strategic outlooks means you can address both the historical performance and the forward-looking view without jumping to a different deck.
Sales and marketing reviews with cross-functional teams
Sales and marketing teams live in data. Pipeline velocity, conversion rates, customer acquisition costs, campaign ROI—the list goes on. The Sales Marketing Performance section in this template covers those metrics in a way that feels natural for both sides of the table. Marketers can show campaign attribution, while sales can break down deal stages using the same visual language. That shared design helps reduce the friction that sometimes comes up when two teams present their data separately.
Customer and product insights sessions
Product teams often present usage metrics, retention rates, and feature adoption numbers. These can be dry if shown in a standard bullet-point format. The Customer Product Insights slides turn that data into visual stories. You can highlight churn trends, NPS scores, or support ticket volumes in a way that product managers and executives both understand. The infographics make it easy to spot patterns without digging into raw spreadsheets.
Operations and team metric tracking
Operations teams track efficiency, utilization, and process adherence. These metrics are not always the most exciting to present, but they are critical. The Operations Team Metrics section provides a structured way to show things like project completion rates, resource allocation, or timeline adherence. For internal reviews where the audience is less familiar with operational data, the visual clarity helps bridge the gap.
Who gets the most out of this template
The obvious answer is anyone who presents data regularly. But digging a little deeper, the template really shines for three types of users:
- Startups and scale-ups that want to look more established than their size suggests. A polished board deck can change how investors perceive maturity.
- Internal analytics teams that need to report to leadership without spending hours on slide formatting. Since everything is editable, you can reuse slides month after month with updated data.
- Consultants and agency professionals who present to multiple clients. The neutral blue–silver palette works with most brand colors, and the light and dark modes give flexibility depending on the presentation setting.
Practical considerations before using the template
No template is perfect for every situation, and being aware of the tradeoffs saves time down the line.
Strengths to lean into
- The file includes both Google Slides and PPTX formats, so you are not locked into one ecosystem. If your team uses Google Workspace but your client uses PowerPoint, you can share the right format without conversion headaches.
- The use of free fonts means you do not need to purchase licenses or hunt down missing typefaces. Download links are included in the documentation guide, so setup is straightforward.
- The master slides structure allows you to batch-edit fonts, colors, and layouts across all slides. If your company rebrands or you need to adjust the color palette for a specific audience, you can do it in minutes rather than slide by slide.
Limitations to keep in mind
- The images used in the preview are for demonstration only. That is standard for presentation templates, but it means you will need to source your own screenshots and photos. If you rely heavily on imagery, factor in time to find visuals that match the metallic aesthetic.
- The metallic look, while modern, may not suit every industry. Creative agencies, education, or non-profit organizations might prefer a warmer or more muted palette. It is worth considering your audience before committing to the design.
- The 30-slide count provides a solid structure, but if your presentation needs more than that, you may need to duplicate and customize additional slides. The master slide setup makes that easier, but it is not an unlimited deck out of the box.
How different teams can customize the sections for their own needs
One of the stronger aspects of this template is that the sections are named in a way that invites adaptation. You do not have to use the Executive Overview strictly for executives, for example. A product team could repurpose it to summarize sprint performance. A marketing team could use the Company Financial Health section to track budget burn versus spend. The labels guide you, but they do not restrict you.
The Risk Strategy section is particularly versatile. It can hold competitive analysis, market risk assessments, or even internal project risk tracking. If you are presenting to a team that values forward-looking thinking, this section gives you a natural place to put that content without forcing new slides into an existing structure.
The small details that make editing smoother
Anyone who has edited a presentation template before knows the frustration of clicking on an element only to realize it is grouped or locked. In this deck, the elements are built to be editable. That means you can resize a chart, change a bar color, or update a percentage without fighting the file. The picture placeholders are included, so when you drag your own image in, it fits the frame automatically. These are small things, but they add up over the course of a busy reporting cycle.
The documentation guide that comes with the download covers the font links and basic editing steps. It is not a long manual, but it answers the common questions that come up during setup. If you are the kind of person who reads the guide before opening the file, you will save yourself a few clicks.
When to use light mode versus dark mode
Both modes are included, and the choice depends more on the room than on personal preference. Dark mode works well for evening presentations, smaller conference rooms, or virtual meetings where the audience is looking at screens. Light mode is better for bright rooms, printed handouts, or situations where you need high contrast for readability. Having both options means you do not have to rebuild the deck for different environments. You just switch the mode and adjust the data.
Final practical note on working with the template
If you are planning to use this for recurring reporting, invest a little time upfront in duplicating the master slide and setting your default fonts and colors. That way, each month you just replace the data in the existing slides rather than rebuilding from the base template. The 16:9 Full HD resolution (1920x1080 px) means it displays cleanly on most monitors and projectors without awkward cropping or stretching.
Metrixa – KPI Dashboard Google Slides works best when you treat it as a framework rather than a fixed deck. The metallic design gives it a distinct look, but the real value is in how much you can adapt it to your own data, your own stories, and your own audience. Whether you are presenting to a board, a sales team, or an internal ops group, having a clean, editable, professional foundation makes the entire process faster and the final result more credible.